Causal Loop Anatomy
Causal Loop Diagrams have four basic parts:
- Nodes (usually ellipses or circle) that contain values that can change
- Lines with an arrow show influence direction
- An inversion indicator
- Time delay indicator
These look like
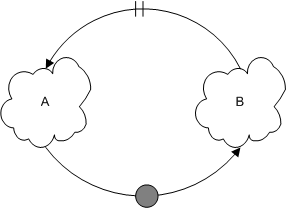
Using all the parts, we can build a simple diagram.
Reading a Causal Loop Diagram
You can start reading a CLD on any node. I once sent a CLD to a friend who responded, “Don, I don’t understand what you’re trying to show.” I promptly started telling the story (via email), but noticed that I had to start at a specific node, and by the time I was 1/3 through the diagram, my explanation fell apart. I redrew the CLD, and got my point across.
We read the above figure as follows:
- As “B” gets bigger, after a time delay “A” gets bigger.
- As “A” gets bigger, “B” gets smaller.
- As “B” gets smaller, after a time delay “A” gets smaller.
- As “A” gets smaller, “B” gets larger.
This forms a balancing loop. The system may oscillate, but will stay within limits. Balancing loops provide stability in systems.
Suppose the influence between “A” and “B” wasn’t inverse. As “A” goes, so goes “B”. The above figure would then read:
- As “A” gets bigger, “B” gets bigger.
- As “B” gets bigger, after a time delay “A” gets bigger.
Or the in the opposite direction:
- As “B” gets smaller, after a time delay “A” gets smaller.
- As “A” gets smaller, “B” gets smaller.
Now we have a reinforcing loop. Reinforcing loops create growth (positive reinforcement) or decay (negative reinforcement). Some people refer to these as positive feedback and negative feedback loops. Since all loops in a CLD are feedback loops, I prefer the terms “balancing”, “positive reinforcement”, and “negative reinforcement”.
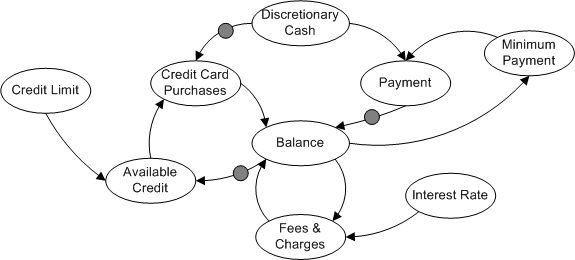
The example we’ve been using a simple diagram. These same basic diagramming parts can build complex diagrams. At the AYE 2004 Conference, attendees in Session 11 created a CLD for credit cards. For those wondering, Causal Loop Diagram and Diagram of Effects are the same drawing type. A CLD for credit cards could resemble
Balance seems to be in the middle of the drawing, so let’s “read” that part of the diagram.
- As Balance goes up, Fees & Charges go up
- As Fees & Charges go up, Balance goes up
- As Balance goes up, Available Credit goes down
- As Credit Card Purchases go up, Balance goes up
- As Payment goes up, Balance goes down
Take a minute to “read” the rest of the drawing. No wonder Albert Einstein said Compounding interest in the greatest mathematical discovery of all time.”
Some things to remember:
- You can start reading a CLD at any point.
- It would be equally valid to say the opposite of our list. (As Balance goes down, Fees & Charges go down)
- A CLD is a map and should “map to the territory”. If the story you’re reading doesn’t match the events and patterns, the CLD needs to be changed.
Different notations exist for CLDs. Some notations use “+” and “-” at the line’s arrow end to show “same” or “inverse” links. Occasionally you’ll see a “B” or a “see-saw” in the middle of a loop indicating the loop balances. A “snowball” or “R” indicates a reinforcing loop. The variables may not be in an ellipse. These minor variations don’t change how the CLD gets read. No “UML” exists for CLDs.
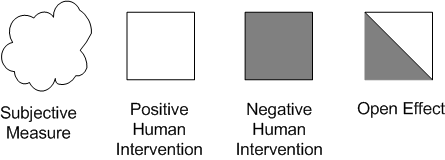
Jerry Weinberg developed additional CLD notations to help understand software project management and development. These components add some richness (by showing the human part) and are:
In Jerry’s notation, these have the following meaning:
- A cloud indicates a subject measure. Something known and true, but unmeasurable (due to nature or expense)
- A white box means that a human intervention is making the receiving node move the same as the originating node
- A gray box means that a human intervention is making the receiving node move opposite from the originating node
- A half-white/half-gray box means that the receiving node may move same or opposite from the originating node base on the intervention
I recommend Jerry’s Quality Software Management: Vol. 1: Systems Thinking. The book builds a systems foundation for understanding software development and uses CLDs throughout the book.
Causal Loop Diagrams provide a to describe what happens in the real world. While notations differ slightly, the basics don’t change. Understanding how to read one notation enables us to understand other notations.


